App
Inspectr Request Inspection
Capture the MCP requests your agents send during an evaluation and open them per scenario run in Inspectr.
Why Inspect MCP Traffic?
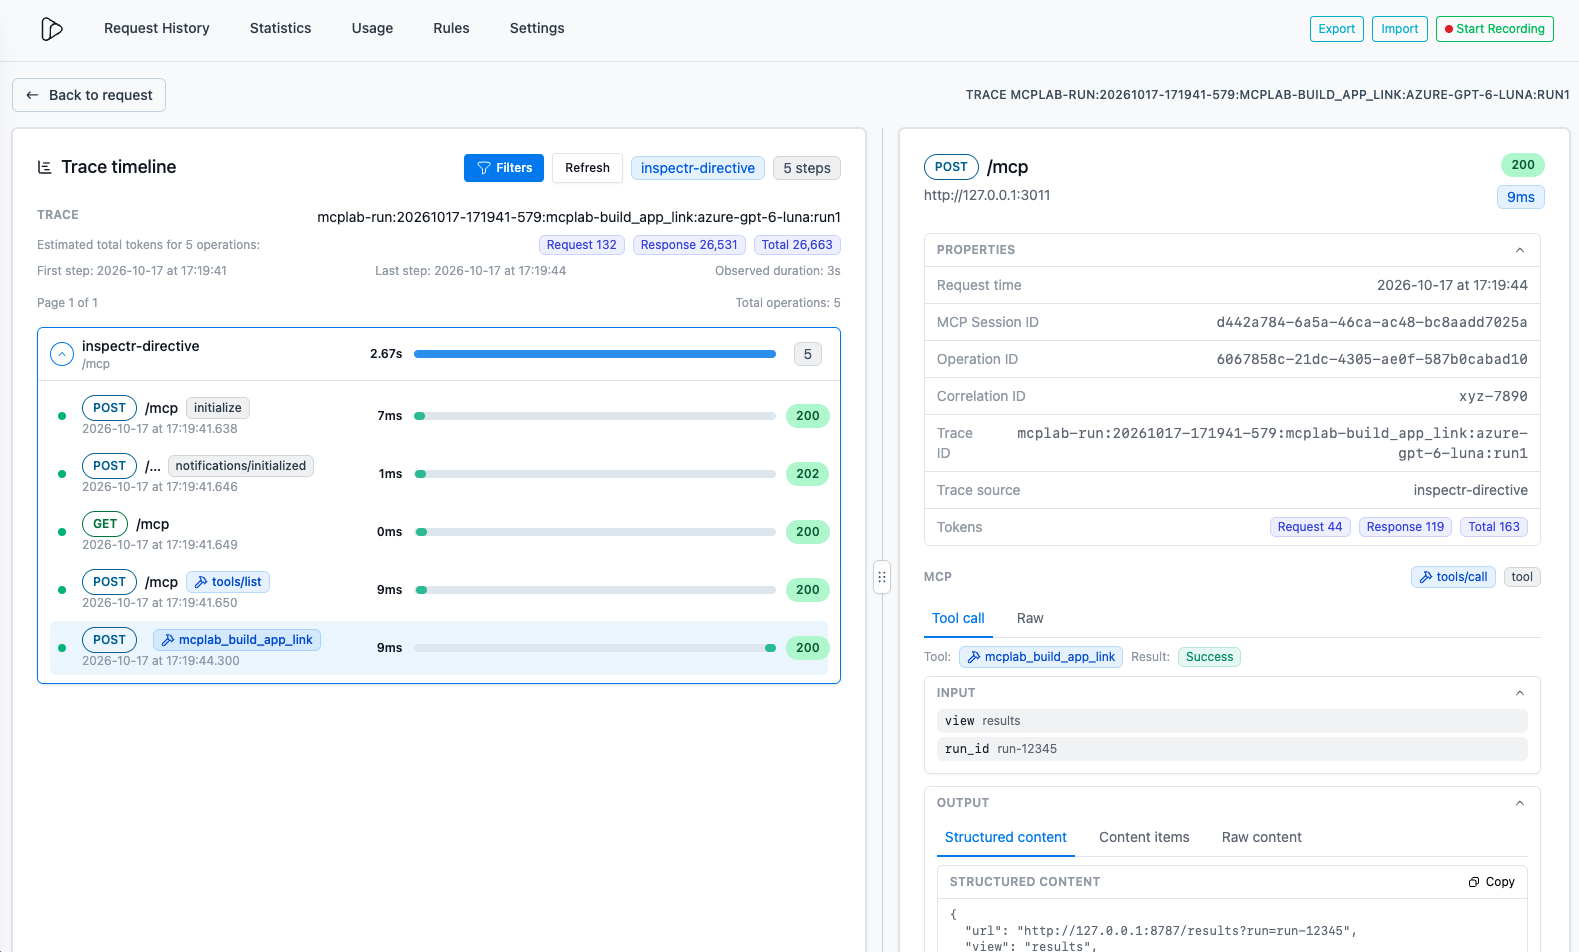
MCPLab tells you whether an agent completed a scenario: which tools it called, whether the checks passed, and how long it took. When a scenario fails or behaves oddly, the answer is often one level lower, in the MCP requests and responses themselves.
Inspectr captures that traffic. Enable it on an MCP server, run an evaluation from the App, and open the exact requests for any scenario run from the result page. No changes to your MCP server or evaluation config are needed beyond one switch.
- Did the agent send the tool arguments you expected, or a slightly different shape?
- What did the server actually return, and is the result the agent summarised the same one it received?
- Did
initialize,notifications/initialized, ortools/listfail or return an unexpected tool list? - Which call was slow, which status code came back, and which headers were sent?
- How large were the request and response payloads, and roughly how many tokens did a tool result add?
What Inspectr Is
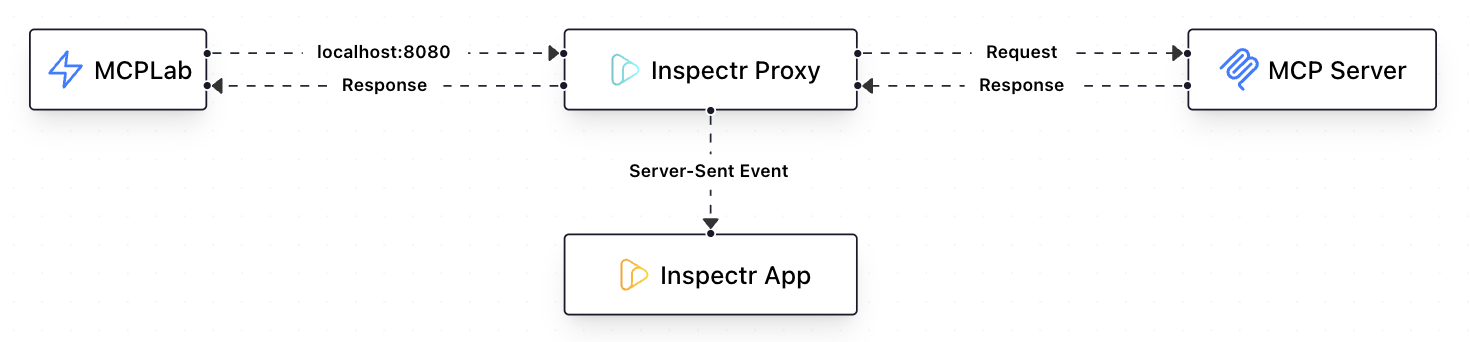
Inspectr is a local request proxy with a browser dashboard. When inspection is enabled for a server, MCPLab starts Inspectr for you, routes that server’s MCP traffic through it, and labels every request with the run, scenario, agent, and server that produced it. Each scenario run becomes one trace in the Inspectr dashboard.
- Runs locally: the proxy and dashboard listen on
127.0.0.1, and captured traffic stays on your machine. - Opt-in per server: only servers you enable are proxied. Other servers in the same evaluation connect directly.
- Best-effort: if Inspectr cannot start, the evaluation still runs without inspection and logs a warning.
1. Get Inspectr
Run MCPLab with npx. Inspectr ships as an optional dependency of @inspectr/mcplab, so npx fetches it together with MCPLab and the App uses that copy. There is nothing extra to install, and the App starts normally even if Inspectr is unavailable.
To try Inspectr on its own first, use the quick start from inspectr.dev: point it at your MCP server with --backend and open the dashboard on http://localhost:4004. This standalone run is optional; MCPLab starts its own Inspectr processes during evaluations.
npx @inspectr/mcplab app --opennpx @inspectr/inspectr --backend="http://127.0.0.1:3011"2. Enable Inspectr on a Server
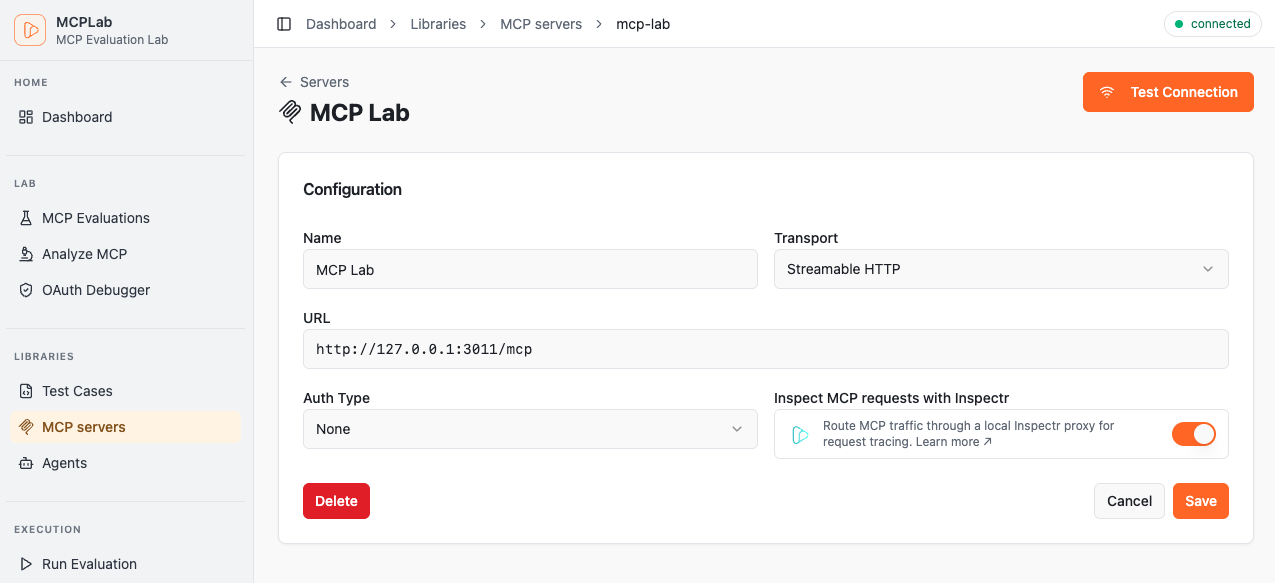
Open Libraries → MCP servers, select the server, turn on Inspect MCP requests with Inspectr, and select Save. The setting is stored on the server, so every App evaluation that uses it is inspected until you turn it off.
You can also enable it in YAML. The inspectr block works on server library entries, inline servers in an evaluation config, and scenario-scoped mcp_servers.
- Inspection is off by default.
- Only
transport: httpservers can be inspected. - Headers and authentication configured on the server are still sent; the proxy forwards requests to the original URL.
mcp-lab:
  name: MCP Lab
  transport: http
  url: http://127.0.0.1:3011/mcp
  inspectr:
    enabled: true
3. Run an Evaluation from the App
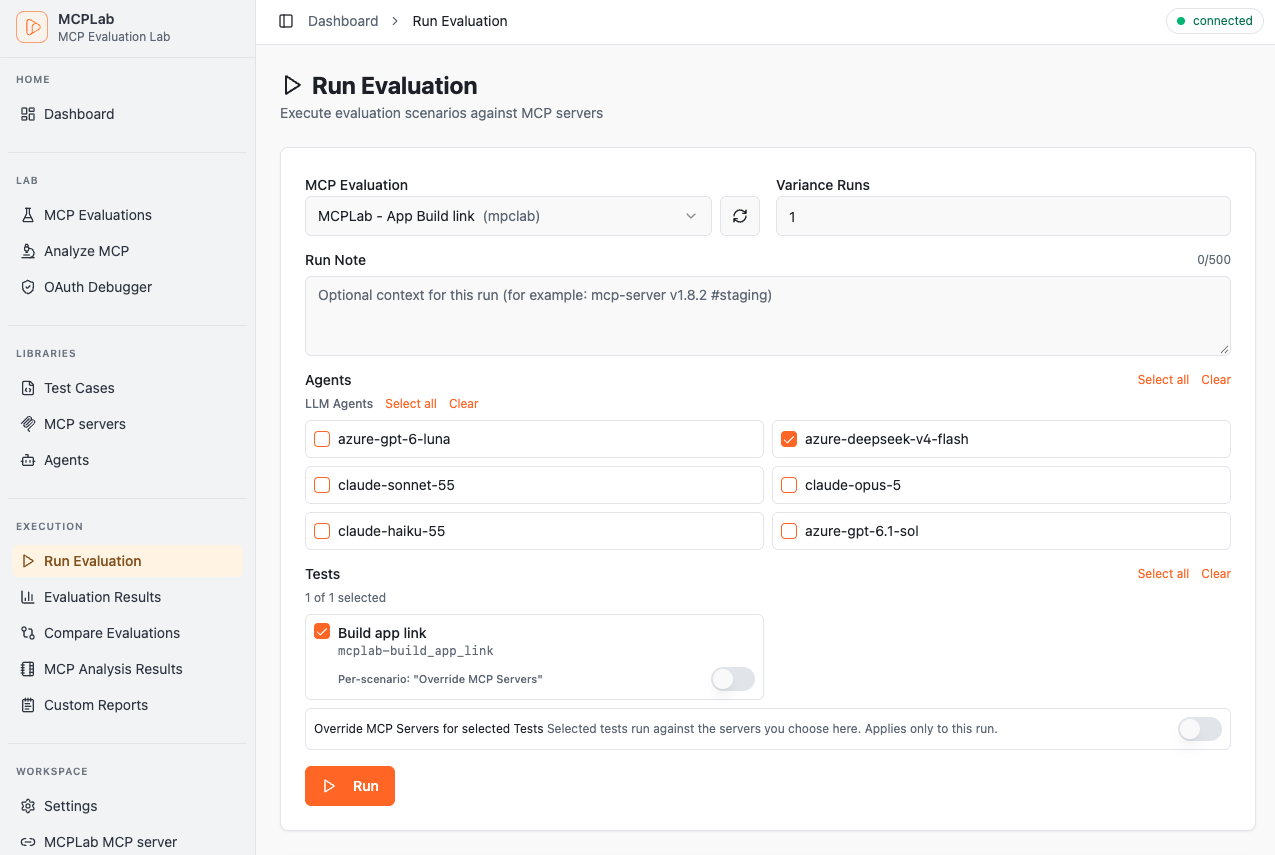
In the App, queue an evaluation from Run Evaluation as usual. When the run starts, MCPLab starts Inspectr for each inspected server and shows an Inspectr: Open <server> link in the run progress, so you can watch requests arrive live.
Inspection only applies to runs queued from the App. mcplab run connects to servers directly and prints a warning when a server has Inspectr enabled.
Inspectr is enabled for server(s) mcp-lab, but 'mcplab run' does not route traffic through Inspectr. Queue the evaluation from 'mcplab app' to inspect its MCP requests.4. Open a Scenario’s Trace
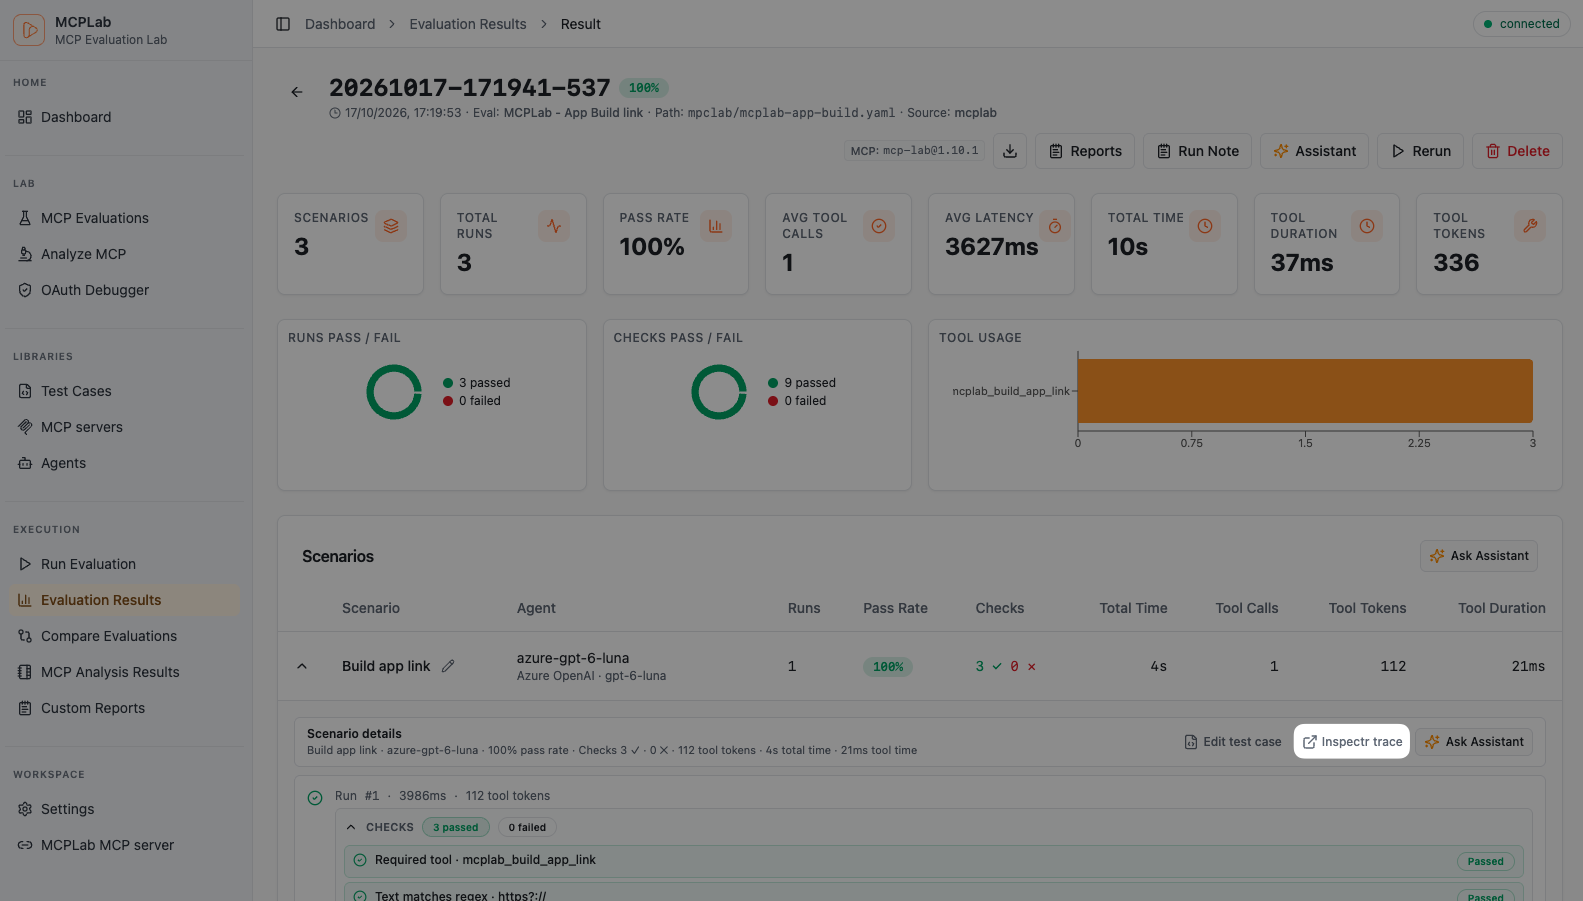
After the run, open Evaluation Results, select the result, and expand a scenario. In Scenario details, select Inspectr trace and choose the run, for example Run #1. When a scenario uses more than one inspected server, each entry also shows the server host.
MCPLab starts Inspectr again if it is no longer running and opens that run’s trace in a new tab. See Analysing Results for the rest of the result page.
- The button only appears for scenarios that were run with inspection enabled.
- Results recorded before inspection was enabled cannot be inspected retroactively.
Read the Trace
The trace timeline lists every request of the scenario run in order, with its method, MCP operation, duration, and status code. A typical run starts with initialize, notifications/initialized, and tools/list, followed by one tools/call per tool the agent used.
Select a request to see its details on the right.
- Trace ID:
mcplab-run:<run id>:<scenario>:<agent>:run<n>, so you can tell runs and repeats apart. - Properties: request time, MCP session ID, operation ID, and estimated request, response, and total tokens.
- Tool call: the tool name, result status, input arguments, and output as structured content, content items, or raw content.
- Raw: switch from the formatted tool-call view to the raw MCP message.
- The trace header shows the observed duration and estimated tokens for all operations in the run.
How It Works
MCPLab runs one Inspectr process per inspected server origin and reuses it across runs. The process listens on free local ports for the proxy and the dashboard and forwards traffic to the original server.
- MCPLab replaces the origin of the server URL with the local proxy and keeps the path and query, for example
http://127.0.0.1:3011/mcpbecomeshttp://127.0.0.1:<proxy port>/mcp. - Each request carries an
inspectr-tagheader (mcplab,mcplab-run:<id>,mcplab-scenario:<id>,mcplab-agent:<name>,mcplab-server:<name>) and aninspectr-trace-idheader that groups the scenario run into one trace. - Session data is stored in
.inspectr-sessions/inside the libraries directory (mcplabby default, set withmcplab app --libraries-dir). - Inspectr processes stop when the App stops.
results.jsonrecords the inspected server origins per scenario ininspectr_origins. MCPLab uses this to decide where to show the Inspectr trace button.
Troubleshooting
- Inspectr is not installed: optional dependencies were skipped, for example with
--omit=optional. Run MCPLab withnpx @inspectr/mcplab appwithout that flag, or install Inspectr globally withnpm install -g @inspectr/inspectrsoinspectris on your PATH, then queue the run again. - The run log shows Inspectr is unavailable … Running without request inspection: Inspectr could not start for that server. The run completed without a trace; check the App terminal output for the reason and retry.
- No Inspectr trace button on a scenario: the scenario ran without inspection. Enable Inspectr on the server and rerun the evaluation from the App.
- Could not open Inspectr with origin was not inspected with Inspectr in this run: that server was not proxied during the run. Enable Inspectr on the server and rerun the evaluation from the App.
- Your editor flags
inspectr:in YAML: the published JSON schema does not list the field yet. MCPLab loads it correctly.